Make a stacked bar chart summarising many survey questions
plot_many_questions.RdMake a horizontal stacked bar chart to summarise several survey questions, with questions ordered according to the proportion of responses that fit a particular pattern.
Usage
plot_many_questions(
  dat,
  labels_vec = NULL,
  percCut = 5,
  colo = NULL,
  order_values = NULL,
  titleText = NULL,
  fill_label_width = 20,
  question_label_width = 30
)
Arguments
- dat
a tibble/data.frame, each variable corresponding to a question. All variables should be factors and all with the same possible values.
- labels_vec
a named vector of labels to use for the questions on the plot. Names are variable names and values are corresponding labels.
- percCut
numeric scalar (0-100). Cutoff below which percentages are not shown in bar segments. Default
5.- colo
(optional but recommended) vector of colours to use for the fill scale (character vector of colours, length the same as the number of levels of the factor that is the first variable of
dat.) IfNULL(default) the pallete fromOMESurvey::get_OME_colours(type='distinct')is used. Whenna.rm = FALSEa grey colour is prepended for the "No response" level. Note that percentage labels are in white, so the pallete needs to work with that. (... or this function needs upgrading!)- order_values
Optional. Controls how questions are ordered in the plot. May be a character vector of response levels, or the special value
"mean(as.numeric())". See Details.- titleText
Optional text to use as plot title.
- fill_label_width
Optional integer. Width (in characters) used when wrapping fill labels with
stringr::str_wrap(). Passed toOME_stacked_bar(). Default is 20.- question_label_width
Optional integer. Width (in characters) used when wrapping axis labels with
stringr::str_wrap(). Default is 30.
Details
The order_values argument controls how questions are ordered in the
horizontal bar chart.
If
order_valuesis a character vector of response levels (e.g.c("Strongly agree", "Agree")), questions are ordered by the proportion of respondents whose answers fall into those levels. (Intended for factors with positive-negative / divergent scales.)If
order_valuesis exactly"mean(as.numeric())", the function instead orders questions by the mean of the numeric codes of the response factor. (Intended for factors with low-high / sequential scales.)
Axis labels are wrapped using stringr::str_wrap() with a width controlled
by question_label_width. Legend/fill labels are treated the same using fill_label_width.
Note
All variables in dat should have identical factor levels.
The names of labels_vec must match the column names of dat.
Values in order_values must be valid levels of the response factor.
Legend placement
By default, the legend is placed horizontally according to the standard
ggplot2 layout. If you want the legend to be centred across the full width
of the final figure, the helper function centre_legend_below() can be used
after plotting. (This must be done after any tweaks to the ggplot theme, annotations, etc)
Examples
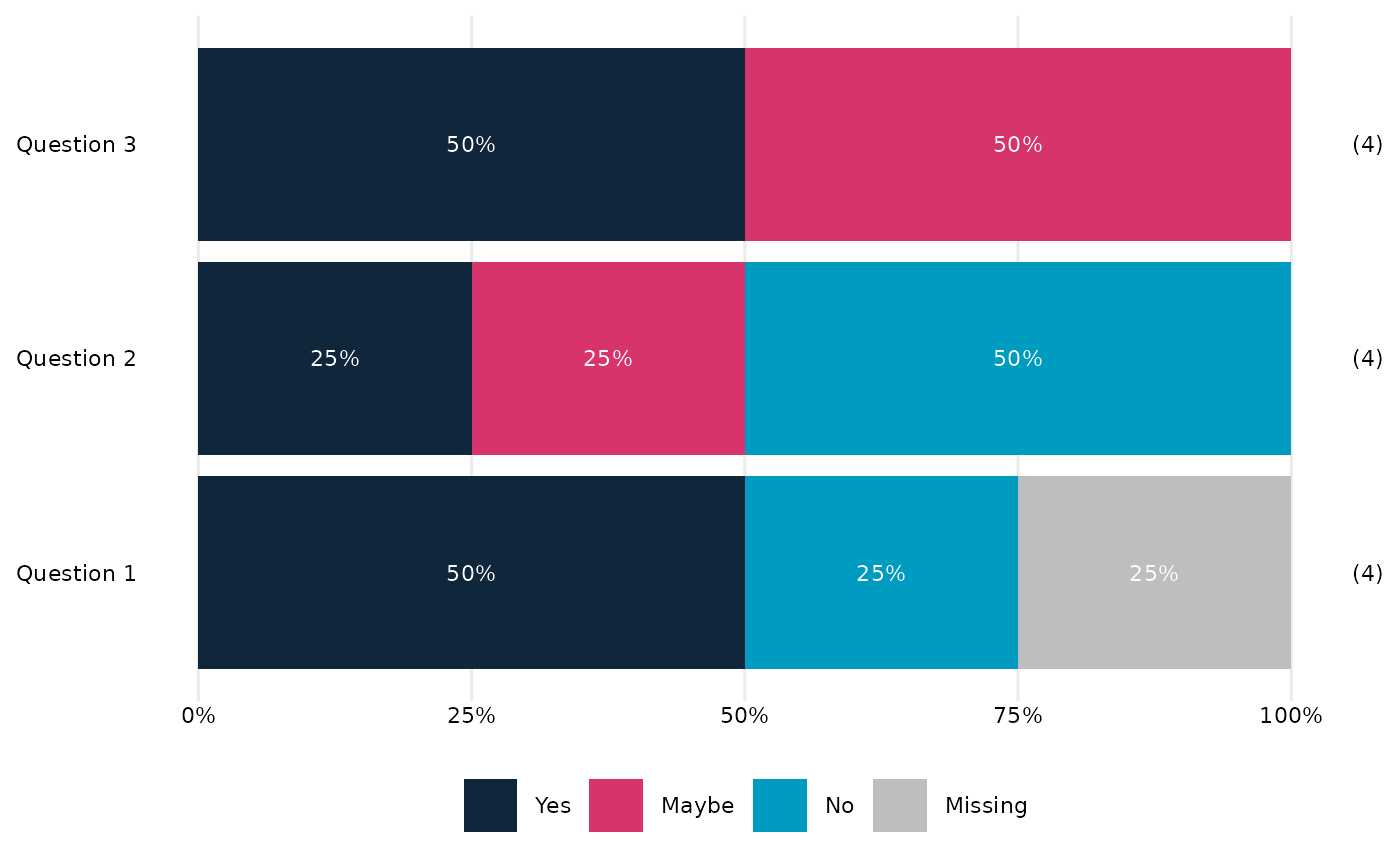
# Minimal example with three questions and three response levels
dat <- tibble::tibble(
  Q1 = factor(c("Yes", "No", "Yes", NA), levels=c("No", "Maybe", "Yes")),
  Q2 = factor(c("No", "No", "Yes", "Maybe"), levels=c("No", "Maybe", "Yes")),
  Q3 = factor(c("Maybe", "Yes", "Maybe", "Yes"), levels=c("No", "Maybe", "Yes"))
)

labels <- c(Q1 = "Question 1", Q2 = "Question 2", Q3 = "Question 3")

plot_many_questions(dat, labels_vec = labels)